The 1% Promise: Which African Governments Are Meeting the Kigali R&D Commitment — and What the Gap Costs the Continent
By BETAR.africa Research Desk | April 2026
In 2007, African Union heads of state gathered in Kigali and made a promise. Their governments would spend at least 1% of gross domestic product on research and development by 2010. Sixteen years past that target date, with a new continental education strategy freshly launched and a continent-wide AI investment wave in full swing, almost no one is checking whether the commitment was kept.
The answer is uncomfortable: for most AU member states, it was not.
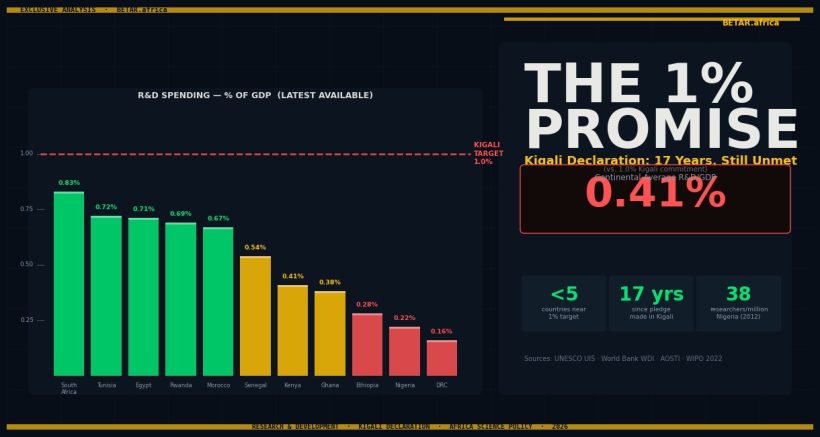
A BETAR.africa analysis of data from the UNESCO Institute for Statistics (UIS), the World Bank World Development Indicators database, and the African Observatory of Science, Technology and Innovation (AOSTI) finds that the continental average for research and development expenditure as a percentage of GDP stands at approximately 0.41% — less than half the Kigali target, and barely changed from 2010. Fewer than five African countries are meaningfully close to the 1% threshold. None have definitively crossed it.
At a moment when African governments are trumpeting AI strategies, digital economy frameworks, and innovation ecosystems, this data gap matters: you cannot build a credible research economy on 0.4% of GDP.
What the Numbers Show
South Africa remains the continent’s leading R&D spender in proportional terms, allocating 0.83% of GDP to research and development as of 2020, according to the Department of Science and Innovation’s National R&D Survey — the most recent available. Tunisia sits at 0.72% (UNESCO UIS, 2020), Egypt at 0.71% (2019), and Morocco at 0.67% (2020). Rwanda, which has aggressively built research infrastructure since the early 2010s, reached 0.69% in 2019 — the single most significant improvement on the continent over the past decade.
Below this tier, the figures drop sharply. Senegal allocates 0.54%, Kenya 0.41%, Ghana 0.38%. Among the continent’s three largest economies by population — Nigeria, Ethiopia, and the DRC — the data is both sparse and discouraging. Nigeria’s most recent UNESCO UIS figure is 0.22%, recorded in 2015, making it impossible to track any post-rebasing improvement. Ethiopia records 0.28% (2019), Tanzania 0.26% (2019), and the DRC an estimated 0.16% (2018).
The researcher pipeline tells a parallel story. Tunisia leads the continent with 1,814 researchers per million population (UNESCO UIS, 2020) — a figure that compares favourably with middle-income countries globally. Morocco reports 970 per million, Egypt 948, and South Africa 556. Kenya reaches 363, Senegal 262, Ghana 201. At the far end, Nigeria’s most recent figure — 38 researchers per million, from 2012 — reflects both a data infrastructure problem and a structural one.
Patent applications filed through WIPO show the output inequality in sharp relief. South Africa accounted for 3,485 patent filings in 2022, Egypt for 946, Morocco 447, and Tunisia 203. Kenya filed 134, Nigeria 58, Rwanda 41, Ghana 38. For a continent of 1.4 billion people, these figures represent a near-total absence from the global intellectual property economy.
The Country Comparison Table
| Country | R&D/GDP % (latest year) | Data Year | Researchers per million | Patent filings (WIPO, 2022) | Kigali gap (pp) |
|---|---|---|---|---|---|
| South Africa | 0.83% | 2020 | 556 | 3,485 | −0.17pp |
| Rwanda | 0.69% | 2019 | 168 | 41 | −0.31pp |
| Tunisia | 0.72% | 2020 | 1,814 | 203 | −0.28pp |
| Egypt | 0.71% | 2019 | 948 | 946 | −0.29pp |
| Morocco | 0.67% | 2020 | 970 | 447 | −0.33pp |
| Senegal | 0.54% | 2019 | 262 | N/A | −0.46pp |
| Kenya | 0.41% | 2018 | 363 | 134 | −0.59pp |
| Ghana | 0.38% | 2020 | 201 | 38 | −0.62pp |
| Ethiopia | 0.28% | 2019 | 77 | N/A | −0.72pp |
| Tanzania | 0.26% | 2019 | 56 | N/A | −0.74pp |
| Nigeria | 0.22% | 2015 | 38 (2012) | 58 | −0.78pp |
| DRC | ~0.16% | 2018 est. | 34 (est.) | N/A | −0.84pp |
Sources: UNESCO Institute for Statistics; World Bank World Development Indicators; WIPO IP Statistics; DSI National R&D Survey (South Africa). Note: Data reflects most recent available year per country. N/A indicates insufficient WIPO filing data for disaggregated country totals.
Why the Gap Persists
Three structural factors explain why Kigali remained aspirational rather than operational.
First, private sector R&D is nearly absent. In high-income countries, corporations fund 60–70% of all research and development spending. In most African markets, government ministries and bilateral donors carry the majority of the load. Without a manufacturing base generating industrial R&D or a deep-technology sector reinvesting into product development, the structural multiplier that makes the 1% target achievable elsewhere does not exist. Africa’s private R&D share remains below 20% of total GERD (Gross Expenditure on R&D) across most markets, according to AOSTI.
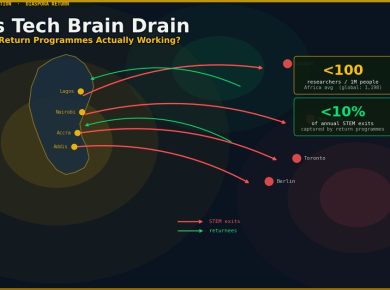
Second, the research talent pipeline leaks continuously. The African Union estimates the continent loses more than 30,000 qualified academics and professionals annually to emigration — a figure concentrated among the STEM-trained cohort most likely to generate patentable research output. Countries that have invested in research institutions, including South Africa and Kenya, face the steepest attrition: trained researchers leave for positions at European and North American universities that offer salaries Africa’s public institutions cannot match.
Third, data infrastructure itself is broken. Nigeria’s R&D figure is from 2015. Meaningful trend analysis for Ethiopia and Tanzania is nearly impossible at the sub-sector level. This is not just a reporting problem — it reflects the absence of the institutional architecture (functioning national research councils with robust M&E systems) that would generate the data in the first place. AOSTI’s own member-state surveys are constrained by the quality of what governments submit.
What This Means for the AI and Deep-Tech Moment
The timing of this analysis matters. African governments are currently approving national AI strategies at a pace unseen in the continent’s policy history. South Africa’s cabinet approved its National AI Policy in early 2026. Kenya’s AI Bill is before Parliament. Nigeria’s AI Bill awaits presidential assent. Morocco’s Digital 2030 roadmap prominently features AI governance. Egypt is positioning itself as a regional AI hub.
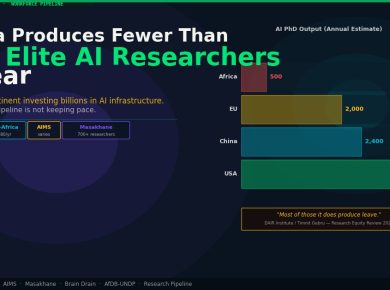
All of these frameworks point downstream — toward deployment, governance, and adoption of AI technologies. Very few address the upstream research investment that determines whether Africa becomes a user or a builder of those technologies. A continent spending 0.4% of GDP on R&D will not produce the foundational model research, materials science breakthroughs, or healthcare AI training datasets that create lasting technological leverage.
AOSTI’s most recent Science, Technology and Innovation (STI) outlook frames the distinction directly: deploying AI is now relatively cheap, but building AI — generating training datasets, developing localised models, producing the underlying research — requires institutional scientific capacity that takes decades to construct. The Kigali commitment was designed to fund precisely that foundational layer.
The newly launched CESA 2026-2035 (Continental Education Strategy for Africa) includes innovation as a core pillar, but critics note it contains aspirational targets without binding funding mechanisms — a structural repetition of the original Kigali Declaration problem.
The Narrow Path Forward
Three countries offer partial models. Rwanda’s improvement from near-zero to 0.69% over a decade reflects deliberate policy: the Rwanda National Science and Technology Council was given constitutional backing, the government set sector-specific research budgets, and the Kigali Innovation City was created as a physical anchor for the research economy. None of this is costless — Rwanda has financed part of this push through donor alignment and concessional debt — but the institutional intentionality is visible in the data.
Morocco’s National Pact for Industrial Emergence included specific R&D targets for the aerospace and automotive sectors, driving private co-investment. Egypt’s National Strategy for Science, Technology and Innovation 2030 set phased targets. Tunisia’s comparatively high researcher-per-million figure reflects decades of university system investment that predates the Kigali Declaration.
What none of these cases demonstrate is a continental mechanism that moves the aggregate number. Nineteen years after Kigali, the African Union has no effective enforcement architecture for the 1% commitment, no transparent reporting standard, and no consequence for non-compliance. AOSTI publishes data. It does not compel action.
For Africa’s technology ambitions to be more than strategic documents, that gap — between the announcement and the accountability — needs its own intervention.
Data Notes
All R&D expenditure figures are drawn from UNESCO Institute for Statistics (UIS) via the UIS data browser and World Bank World Development Indicators (indicator GB.XPD.RSDV.GD.ZS), supplemented by national research council publications where UIS data is unavailable or significantly lagged. Patent data is from WIPO IP Statistics Data Center (2022). Researcher density figures are UNESCO UIS (indicator R&D-2). All figures are the most recent available year per country; data collection years vary due to national statistical reporting cycles. The continental average of ~0.41% is sourced from the African Union Commission / AOSTI Science, Technology and Innovation Strategy for Africa (STISA-2024) progress monitoring report. The figure of 30,000 annual emigrating academics and professionals is from the African Union Commission’s African Union Human Capital Development Report (AU Commission, 2019), as cited in subsequent AU Commission STI policy briefs.