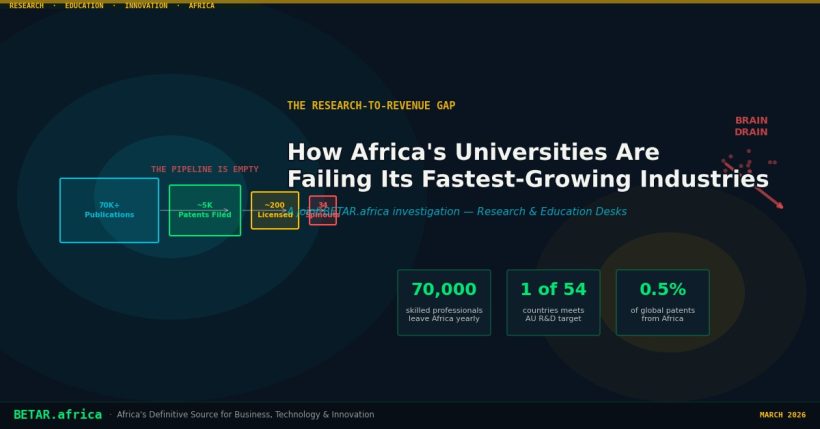
The Research-to-Revenue Gap: How Africa’s Universities Are Failing Its Fastest-Growing Industries
Africa’s universities have never produced more research. The pipeline from that research to commercial value has never been emptier. A joint BETAR.africa investigation maps the full gap: concentrated research capacity, a brain drain accelerating faster than any return programme can reverse, technology transfer offices that exist on paper but license zero patents, and a decade of AU spending commitments that expired unmet. Four country interventions show what deliberate structural investment looks like when it works — and why it is not spreading fast enough.
March 2026
The pipeline is empty. That is the most accurate summary of Africa’s research-to-revenue relationship in 2026 — not that research is not being produced, but that the infrastructure required to convert knowledge into commercial value is either absent, underfunded, or has never been built at all.
Africa’s universities are producing more research than at any point in the continent’s history. Citation counts are rising. International collaboration is deepening. Egypt has become the continent’s first country to meet the African Union’s own R&D spending target. QS launched its first dedicated Sub-Saharan Africa university ranking in February 2026. The headline indicators are, selectively read, encouraging.
But the indicators that matter most to the continent’s fastest-growing industries — technology, fintech, health innovation, renewable energy, digital services — tell a different story. Technology transfer offices that license zero patents. A skilled professional emigration rate of 70,000 per year. Thirty-five of 54 African countries unable to measure their own research spending. A continental innovation fund promised in 2014 that has still not been capitalised. The gap between what African universities produce and what African industries can actually use is structural, not incidental. It will not close without deliberate investment in the institutions that convert knowledge into capital.
This investigation examines the gap in five parts: the current state of African university research capacity and rankings; the brain drain that is removing the human capital those institutions produce; the technology transfer pipeline that fails to connect patents to products; the government policy architecture — and its chronic underfunding — that surrounds all of it; and the country-level interventions that demonstrate what structural alignment looks like when it works.
Section 1: Research Output Benchmarks — African Universities in Global Rankings, 2022–2025
The most revealing number in African higher education right now is not a ranking position. It is a ratio: six out of the top ten African universities by research output are South African, yet South Africa holds roughly 60 million people in a continent of 1.4 billion. A country representing about four percent of Africa’s population generates the majority of its research footprint. That concentration — more than any single rank figure — defines the landscape that the continent’s fastest-growing industries must navigate when they look to universities for knowledge, talent, and innovation.
Across four major ranking systems — QS World University Rankings, the Academic Ranking of World Universities (ARWU, known as the Shanghai Rankings), the Center for World University Rankings (CWUR), and EduRank — the pattern is consistent and compounding. The University of Cape Town (UCT) is Africa’s anchor institution in every framework: ranked #171 in QS 2025 and climbing toward #150 in the 2026 cycle, placed in the 201–300 band in ARWU for five consecutive years (the only African university in the global top 300), ranked #271 globally by CWUR with a score of 77.4, and sitting at #246 worldwide in EduRank’s 2025 research output measure. No other African institution comes close to that consistency across methodologies.
| Rank (Africa) | Institution | Country | Global Rank |
|---|---|---|---|
| 1 | University of Cape Town | South Africa | #246 |
| 2 | University of the Witwatersrand | South Africa | #398 |
| 3 | University of Pretoria | South Africa | #406 |
| 4 | Stellenbosch University | South Africa | #428 |
| 5 | Cairo University | Egypt | #522 |
| 6 | University of KwaZulu-Natal | South Africa | #618 |
| 7 | Makerere University | Uganda | #759 |
| 8 | University of Johannesburg | South Africa | #769 |
| 9 | University of Nairobi | Kenya | #815 |
| 10 | UNISA | South Africa | #840 |
Source: EduRank 2025. University of Ghana ranks #943 globally; University of Ibadan (Nigeria) ranks #963.
Beyond the South African bloc, Egypt is the period’s most significant story. Cairo University moved from the QS #571–580 band in 2022 to #347 in the 2026 cycle, a gain of more than 200 places. Ain Shams University made an even steeper climb — from the 801–1,000 band in 2022–2023 to #542 in QS 2026, and advanced in ARWU from the 701–800 tier to 601–700, where it has held since 2023. Egypt’s trajectory reflects a deliberate national investment in research publication volume and international collaboration linkages, the precise metrics that ranking methodologies reward.
Among South African institutions, two moves stand out. Stellenbosch gained approximately 170 QS places in a single year between 2023 and 2024, jumping from #454 to #283. UCT added 87 places across two years, from #237 in 2023 to #150 in the 2026 cycle. Both moves are partly structural: QS revised its methodology for 2024, adding employment outcomes, sustainability metrics, and international research networks as new scoring pillars, which produced large one-time rank shifts across the board. Readers should interpret the 2023-to-2024 jumps with that caveat in mind — the underlying improvement is real, but the scale of change overstates single-year momentum.
Not every trajectory points upward. The University of Pretoria improved sharply in QS (from the 601–650 band in 2022 to #354 in 2025) but slid in ARWU from the 401–500 tier to 501–600 between 2023 and 2025 — a divergence that signals gains in the newer QS indicators without corresponding growth in the publication-heavy metrics that ARWU weights most heavily. Cairo University shows a similar split: QS gains alongside an ARWU retreat from 301–400 back to 401–500 in 2025. Makerere University, the strongest sub-Saharan African institution outside South Africa, peaked in QS at #901–950 in 2025 before falling back to the 1,001–1,200 band in the 2026 cycle.
The structural gaps are more troubling than any individual dip. Nigeria — Africa’s most populous country, with approximately 40 universities of scale — sees its best institutions, the University of Lagos and the University of Ibadan, enter QS rankings only in 2025 at the #1,001–1,200 level. Makerere and the University of Nairobi, the flagship institutions of East Africa’s two largest economies, do not appear in the ARWU top 1,000 at all. February 2026 brought one meaningful signal of changing awareness: QS launched its inaugural Sub-Saharan Africa dedicated ranking — the first time a major global system has built a framework specifically for the region.
Taken together, the 2022–2025 data tells a story of genuine, measurable progress layered over deep unevenness. The headline numbers are improving. But rankings measure research volume, citation reach, and academic reputation — not whether that research is reaching the entrepreneurs, engineers, and investors building Africa’s next economy. The gap between what the continent’s universities produce and what its industries can actually use is the subject of everything that follows.
Sources: EduRank 2025; QS World University Rankings 2022–2026; ARWU/Shanghai Rankings 2021–2025; CWUR 2024.
Section 2: The Brain Drain Data
Africa is haemorrhaging its most educated workers at a rate that development economists describe as structurally unsustainable. Approximately 70,000 skilled professionals leave the continent every year — an AU Commission estimate that has circulated for more than a decade — at an annual cost to the continent’s human capital base of roughly US$2 billion. The World Bank’s most recent tertiary-educated emigration rate for Sub-Saharan Africa, drawn from its SM.EMI.TERT.ZS indicator, stands at 13 per cent of the tertiary-educated population. That figure dates to 2010/2011 — an important methodological caveat discussed below — but provides the clearest longitudinal benchmark available.
A note on the data before we proceed: the World Bank’s KNOMAD unit, which maintained the most comprehensive country-level migration and remittances datasets, formally wound down in 2024. There is no updated country-level STEM emigration rate series for 2022–2025 from any publicly accessible database. What follows draws on the best available sector proxies — primarily healthcare, where departure data is tracked institutionally — combined with general skilled emigration statistics. STEM-specific departures (engineering, computer science, biomedical research) remain undocumented in any standardised series.
The toll on STEM fields is disproportionate, and the healthcare sector offers the most granular evidence. Nigeria is the continent’s starkest case. In a single year — 2024 — 4,193 Nigerian doctors and dentists left the country, according to Nigeria’s Federal Ministry of Health. As of August 2022, 10,096 Nigerian-trained doctors were registered with the UK’s General Medical Council alone. In nursing, the numbers are more dramatic still: approximately 75,000 Nigerian nurses have emigrated cumulatively since 2017, with around 15,000 departing in 2022 alone. The UK’s Nursing and Midwifery Council recorded a 46.6 per cent increase in Nigerian nurses on its register in a single twelve-month period — from 7,256 to 10,639 — between March 2022 and March 2023. A 2024 Tandfonline retrospective cohort study tracking fifteen years of Nigerian doctor emigration found that 69 per cent of Nigerians surveyed said they would emigrate if given the opportunity.
The destination geography follows economic gravity. Among Nigerian doctors tracked in the cohort study, the United Kingdom absorbed 48.5 per cent, Canada 20.9 per cent, and the United States 19.4 per cent. The UK, which operates a Health and Care Worker visa with a dedicated healthcare sub-route, received more than 78,000 skilled worker visas from Nigeria in the year to September 2023 — a figure that represents a 399 per cent increase since 2019. Nigeria, Ghana, and Zimbabwe all appear on the WHO Health Workforce Safeguards list, meaning NHS employers are formally prohibited from actively recruiting from these countries. The prohibition has functioned as a speed bump, not a barrier.
Ghana’s experience benchmarks the structural absurdity. The UK Home Office recorded a 1,328 per cent increase in Ghanaian NHS nurses between 2019 and 2022. WHO estimated in 2022 that more Ghanaian nurses were working in the UK than in Ghana itself. Approximately 500 nurses were leaving Ghana monthly in 2022–2023. The UK issued 26,013 skilled worker visas to Ghanaians in the year to September 2023.
Kenya’s trajectory runs parallel. Approximately 4,000 doctors and nurses leave Kenya annually, per the Kenya Medical Practitioners, Pharmacists and Dentists’ Union. A 2023 Ministry of Health survey found 64.4 per cent of health professionals were actively considering emigration — a figure that registers the depth of the push factor. Kenya’s doctor-to-population ratio stands at 14 per 100,000 against WHO’s recommended 21.7.
South Africa presents a distinctive profile. Statistics South Africa’s 2023 Migration Profile counted 914,901 South African citizens living abroad, with annual departures estimated at approximately 23,000. Afrobarometer Dispatch 914, published in December 2024, found that 10.78 per cent of highly educated South Africans were seriously considering emigration — up from 9.25 per cent in 2022. In the STEM pipeline, the attrition begins earlier: a Professional Provident Society survey found that 90 per cent of South African students intended to work abroad after completing their studies.
Canada and the United States are the other primary sinks. Canada’s Express Entry programme admitted 22,130 Nigerian permanent residents in 2022 and 20,380 in 2023; Nigeria ranked second globally among Express Entry applicants. The Migration Policy Institute estimates approximately 2.5 million sub-Saharan African immigrants are now resident in the United States — three times the figure from 2000.
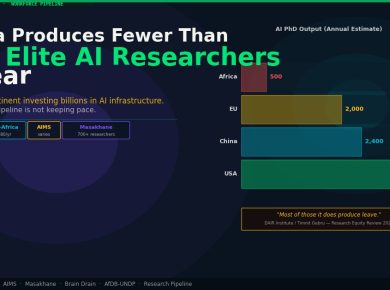
In the AI sector — where Africa’s talent deficit is most acutely visible to global technology companies — the structural dimensions of brain drain have been articulated most precisely by researchers who have built institutions specifically to counter it. Moustapha Cissé founded Google Brain Accra, the continent’s first major AI research laboratory, and later established the KARA Institute to sustain independent research capacity in West Africa. In conference talks and published commentary at NeurIPS Africa workshops, Cissé has argued that the departure of African AI talent reflects a structural environment problem more than a compensation problem: researchers leave because the compute infrastructure, peer networks, dataset access, and career pathways that viable research requires do not exist at home at comparable scale. The same structural logic governs broader STEM emigration. The headline salary differential between Accra and London, or Lagos and Toronto, captures less of the reality than the gap in research infrastructure, grant availability, and the accumulated institutional capacity that determines whether a scientific career is possible — not merely compensated.
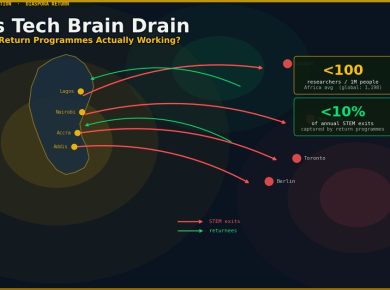
The counter-narrative — brain gain through diaspora remittances — is real but structurally limited as a substitute for retained human capital. Return programme data illustrates the gap. IOM’s Migration for Development in Africa (MIDA) programme, the only continent-wide diaspora return initiative with a cumulative figure, has placed approximately 2,000 professionals back in African institutions over more than two decades of operation — a number that represents a rounding error against the scale of current outflows.
Country-level return figures tell the same story. Ghana’s flagship Year of Return and Beyond the Return programme — perhaps the continent’s most promoted diaspora repatriation campaign — has produced approximately 1,500 permanent relocations since 2019. South Africa’s annual returnees numbered 27,983 in 2023, down sharply from 45,866 in 2011 — a 39 per cent decline over twelve years. The aggregate picture is of a continent that is training its own replacements for developed-world labour markets — a dynamic that is accelerating, not stabilising, and that neither remittances nor current return programmes are positioned to reverse.
Sources: World Bank SM.EMI.TERT.ZS; AU Commission human capital estimates; Nigeria Federal Ministry of Health; UK Home Office skilled worker visa data; UK GMC/NMC registers; Ghana Health Service data; Kenya MPDU/Ministry of Health; Statistics South Africa 2023 Migration Profile; Afrobarometer Dispatch 914 (December 2024); IOM MIDA cumulative data (two-decade total); Canada IRCC Express Entry annual report 2023; Migration Policy Institute; Moustapha Cissé, NeurIPS Africa workshop commentary and published essays on African AI research capacity; KARA Institute.
Section 3: The University-Industry Pipeline — Where It Works and Where It Breaks
At the University of Cape Town, 2024 was a record year. Six new spinoff companies were incorporated in twelve months — SepaTech, Lodestone, Nothile Biopharma, C-STAR, ApneaCure, and Khaya HealthTech — bringing UCT’s cumulative spinout count to 34 since 2004. Invention disclosures climbed to 41, up from 33 the year before. Research contracts jumped from R3 billion to R4 billion in a single year. By African standards, UCT’s technology transfer office looks like a functioning pipeline. It is also, by African standards, the exception that exposes the rule.
Across the continent, universities generate research. Some file patents. A vanishingly small number turn those patents into products. The machinery that sits between a patent and a product — experienced commercialisation staff, pre-seed capital, industry co-development agreements, domestic venture capital, enforceable IP rights — is either absent, underfunded, or has never been built at all.
The South African Illusion
South Africa dominates Africa’s university spinout landscape, but even that dominance is narrower than it looks. Four of the country’s 26 universities account for 70 percent of all spinouts. Stellenbosch’s Innovus unit manages 32 active spinouts backed by a University Technology Fund of roughly $12.6 million. UCT and Stellenbosch are genuinely productive. The remaining 22 institutions, for the most part, are not.
A NIPMO survey found that 60 percent of South African universities say they are not empowered to commercialise their own intellectual property — despite 92 percent of them having a technology transfer office on paper. Having a TTO is not the same as having a working one. And then there is the ownership problem: 79 percent of licenses issued by South African universities go to foreign-owned firms. The research is local. The commercial benefit flows out.
Kenya: A Patent Filing Cabinet
Kenya’s Jomo Kenyatta University of Agriculture and Technology holds 83 IP assets — 26 patents, 21 utility models, 32 trademarks, one industrial design, three copyrights. It accounts for 17 of the 51 patents held by all Kenyan public universities combined, a 33 percent share of the national total. On paper, this looks like IP activity. In practice, the commercialisation rate is near zero.
Of those 83 assets, only four trademarks have been commercialised. Zero patents have been licensed. Zero utility models. The pipeline does not just slow at JKUAT — it stops. Eighty percent of Kenyan researchers who have developed innovations have not protected them at all. Eighty-five percent of the JKUAT community has no IP awareness to speak of. These are not numbers that suggest an institutional failure at the margins. They suggest an institution that generates knowledge in a vacuum, with no reliable channel connecting what researchers create to what the market might buy.
Ethiopia: Decades of Education, Two Patents
Ethiopia has seven decades of formal higher education. It has produced two international patents in total. Contract research and joint industry projects are, by official accounts, almost non-existent. Addis Ababa University, the country’s flagship institution, only formalised its innovation and incubation policy in 2022. A 28.1 percent growth in resident patent filings in 2023 sounds promising until you read the denominator: the base was 82 total filings.
Where the Exceptions Live
The clearest working model on the continent may not be university-led at all. Rwanda’s Kigali Innovation City — a 61.9-hectare campus — and the Mastercard Foundation’s $275.7 million commitment to CMU-Africa announced in September 2022 represent an ecosystem-first approach: attract institutions, build infrastructure, then let university-industry relationships form inside a purpose-built environment. It sidesteps the question of whether existing universities can reform themselves fast enough by building something new around them.
Morocco offers a different lesson. Patent filings grew 167 percent between 2015 and 2019. Universities now drive 64 percent of Moroccan-origin patent filings as of 2025, after TTOs were established from 2022 onward. Tunisia tells a more sobering story: roughly 1.1 percent of GDP in R&D spending, 25 TTOs in operation — described in official assessments as having produced no significant impact on economic development. Infrastructure alone does not produce outcomes.
The World Economic Forum captured the regional picture bluntly in 2022: not a single African country reached the halfway mark on the university-industry collaboration index.
Ghana legislated a National Research Fund in 2020 with a $50 million commitment. As of mid-2024, it was still not operational. Makerere University in Uganda allocates just $730,000 per year for commercialisation-stage projects out of an $8.1 million annual research budget — nine cents of every dollar. Africa’s share of global patent applications sits at roughly 0.5 percent. The combined share of Africa, Latin America and the Caribbean, and Oceania fell from 4.4 percent of global filings a decade ago to 3.2 percent in 2023. The trajectory is going the wrong way.
The gap between African universities and Africa’s industries is not, fundamentally, a knowledge problem. UCT’s researchers know how to build a spinout. JKUAT’s researchers are generating patentable ideas. The problem is structural: the institutions that should convert knowledge into capital — functioning TTOs, domestic pre-seed funds, industry partnership frameworks, IP courts with teeth — either do not exist or exist only on paper.
Sources: UCT Research Contracts & Innovation 2024 Annual Report; NIPMO/SARIMA National IP & TT Survey; WIPO World IP Indicators 2024 & 2025; ARIPO 2023 Statistics; JKUAT IP Commercialisation data; WEF University-Industry Collaboration Report 2022; Uganda Mak-RIF grant data; Ghana GNRF legislative record.
Section 4: Government Policy — R&D Spending and National Innovation Strategies
Twelve years after every African Union member state signed on to spend at least 1% of GDP on research and development, only one country has actually done it.
Egypt crossed that threshold in 2023, recording 1.02% of GDP in gross expenditure on R&D (GERD), according to UNESCO UIS data. Every other signatory to the AU’s Science, Technology and Innovation Strategy for Africa — STISA-2024, the ten-year roadmap that expired last year — fell short. The continental average sits somewhere between 0.33% and 0.45% of GDP, roughly one-third of the commitment made in 2014. Africa accounts for just 1.1% of the estimated USD $2.87 trillion that the world spends annually on research. For a continent that holds 18% of the global population, that number is not a gap. It is a structural wound.
A Promise Without a Mechanism
The STISA-2024 strategy was not short on ambition. It identified priority pillars — food security, disease control, infrastructure, manufacturing, space science — and called on member states to build national innovation ecosystems aligned with AU Agenda 2063. What it never built was any way to make that happen.
The African Science, Technology and Innovation Fund, which was supposed to channel dedicated continental financing toward R&D, was never established. No monitoring and evaluation mechanism was ever created to track whether countries were meeting their commitments. Assessments conducted in the lead-up to STISA’s expiry found that many national officials were unaware the strategy even existed. The design process itself had been largely top-down, with inadequate consultation of the universities, research institutions, and private sector actors who would have needed to implement it. Of 54 African countries, 35 still lack basic R&D expenditure data, meaning that for nearly two-thirds of the continent, no one can even measure whether progress occurred.
The Spending Picture: A Continent of Outliers
Among the countries where data exists, the picture is uneven enough to resist easy generalisation. South Africa, which has historically led sub-Saharan Africa on research infrastructure, recorded 0.85% of GDP in R&D spending in 2022, according to AfDB and DSI data — but that figure has since declined to approximately 0.60%, a trajectory that alarms researchers who depend on the National Research Foundation for funding. Kenya sits at around 0.81%, driven partly by its expanding technology sector and government commitments under successive development plans. Morocco has held a range of 0.71–0.75%, reflecting sustained investment in its university and applied research sectors.
Below those leaders, the numbers become harder to defend. Nigeria, the continent’s largest economy by GDP, spends approximately 0.15% on R&D. Angola — an upper-middle-income oil economy — records 0.03%. These are not countries without resources. They are countries that have chosen not to direct those resources toward knowledge production.
The private sector offers limited compensation. In most high-income economies, business enterprise R&D accounts for 40–70% of total national research spending. In Africa, the private sector share sits at roughly 35% — and that figure is distorted by the relatively strong private sectors in South Africa and a handful of other economies. Across most of the continent, government remains the dominant (and chronically underfunded) funder of research.
External financing is also retreating. Official Development Assistance for R&D fell 7.1% in 2024. Sweden cut USD $16.4 million in Africa-focused development research in 2023, part of a broader pattern of donor retrenchment that exposes the fragility of a research ecosystem built on foreign grants rather than domestic commitment.
| Country | R&D % of GDP | National STI Policy | AU 1% Target Status | Key Gap |
|---|---|---|---|---|
| Egypt | 1.02% | Yes | Target Met | Sustaining momentum; diversifying beyond public-sector spend |
| South Africa | ~0.60% (declining from 0.85%) | Yes | Below Target | Falling public investment; NRF funding pressure |
| Kenya | ~0.81% | Yes | Below Target | Private sector R&D share remains low |
| Morocco | 0.71–0.75% | Yes | Below Target | Applied research commercialisation pipeline weak |
| Tunisia | 0.62% | Yes | Below Target | Brain drain offsetting research capacity gains |
| Nigeria | ~0.15% | In Development | Critically Below Target | Largest economy; spending less than one-sixth of AU target |
| Ghana | Data limited | Yes | Unknown | Insufficient GERD tracking; data gaps |
| Ethiopia | Data limited | Yes | Unknown | Rapid growth but R&D infrastructure nascent |
| Angola | ~0.03% | No | Critically Below Target | Near-zero investment despite oil revenues |
| Cameroon | Data limited | In Development | Unknown | Part of new AU STI Coalition but no published GERD baseline |
STISA 2034: The Same Bet, Again
In February 2025, AU heads of state endorsed STISA 2034 — a new ten-year strategy with, notably, the same 1% of GDP target, now shifted to a 2034 horizon. Officials point to a more inclusive, bottom-up design process as evidence that lessons were learned from the first strategy’s failure. Implementation was formally launched in February 2026 at AU STI Week.
Skeptics are entitled to their skepticism. Africa has been promised this inflection point before. The difference between STISA-2024 and STISA-2034 will not be found in the communiqués — it will be found in whether the African Science, Technology and Innovation Fund is actually capitalised, whether M&E systems are actually built, and whether the 35 countries that currently cannot measure their own R&D spending gain the capacity to do so. The ASTII programme, which trained over 3,500 civil servants in R&D measurement methodologies, represents one concrete building block. The Coalition on STI for Africa’s Development, launched in May 2023 by South Africa, Ethiopia, Cameroon, Ghana, and Morocco, represents another.
They are building blocks without a building. What Africa’s research ecosystem needs is not another strategy document. It needs the funding mechanisms, data infrastructure, and political accountability that transform commitments on paper into laboratories, patents, and industries.
Sources: UNESCO UIS; AU Commission STISA-2024 Midterm Review; AUDA-NEPAD African Innovation Outlook IV (AIO-2024); SGCI Research Funding in Africa Working Paper; WIPO Global R&D Blog 2025; World Bank R&D indicators.
Section 5: Case Studies — What Is Working
Against the grim arithmetic of outward flow, a cluster of deliberate interventions is demonstrating what structured alignment between education systems and industry looks like when it works. Four countries offer the clearest evidence — and the clearest illustration of how far the gap between intent and measurable outcome still runs.
Nigeria: Volume, Gender Equity, and the Placement Gap
Nigeria’s National Information Technology Development Agency (NITDA) has scaled digital skills training to an ambition that would have seemed implausible five years ago. The Three Million Technical Talent initiative — 3MTT — has trained more than 350,000 fellows since its launch, with 91,000 completing Cohorts 1 and 2 as of 2025. Forty-eight per cent of participants are women — a figure that substantially outperforms African STEM workforce averages and signals that the programme is reaching cohorts that traditional university STEM pipelines do not.
The Nigeria Jubilee Fellows Programme (NJFP) has extended the model into employer linkage. Launched in 2024, the NJFP has placed 3,000 graduates directly with employers including Microsoft and Airtel, at no cost to hiring companies — a deliberate friction-reduction mechanism addressing a structural barrier: even well-trained graduates struggle to access formal employment without intermediary support. The model is notable because it inverts the usual skills-training dynamic: rather than training graduates and leaving placement to chance, the pipeline terminates in a committed employer relationship.
What Nigeria’s system still lacks is sustained employment verification at scale — and the absence is a structural accountability failure, not merely a data gap. Without published twelve-month post-placement retention data, neither NITDA nor the federal government can answer the question that determines the programme’s actual value: how many 3MTT fellows remain employed in trained skills a year after placement? The NITDA Digital Literacy for All (DL4ALL) programme enrolled more than 45,000 civil servants per module in 2025, with coverage reaching an estimated 65–75 per cent of the Federal Civil Service workforce — but completion numbers diverge sharply from employment-outcome numbers. Volume is not the problem. Accountable outcomes are. A public programme at 3MTT’s scale, drawing on federal resources and international partnerships, has an obligation to publish verified outcome data as standard. Without it, its contribution to closing the skills gap remains asserted, not demonstrated — and the accountability gap becomes, itself, a systemic feature of Africa’s digital skills infrastructure.
Ethiopia: Institutional Bridges, Mutual Scepticism
Ethiopia’s approach to the research-to-revenue gap is institutional. The government designated Addis Ababa University, Jimma University, Adama Science and Technology University, and Bahir Dar University as first-generation universities with enhanced mandates for industry partnership — a top-down structural push backed by curriculum co-design agreements, equipment grants, and recruitment pipelines with commercial tech sector partners.
The results are measurable, if modest. More than 270 students from Jimma University completed formal industry internship placements in 2024 — a number that has grown year-on-year. A 2025 peer-reviewed study in Discover Education confirmed statistically significant correlations between university-industry collaboration and graduate employability and skills-matching at STEM-designated universities, providing the first robust empirical validation that the structural investment is delivering. STEM enrolments at Ethiopia’s designated institutions have grown by approximately 30 per cent in recent years.
At the commercial layer, the Microsoft–Gebeya partnership — targeting 300,000 developers across eight African countries including Ethiopia over three years — and the Safaricom-Gebeya training programme are building employer-connected pipelines that operate outside formal university structures. Ethiopia’s tech sector is projected to grow at 11.27 per cent annually between 2024 and 2029, generating up to 400,000 new jobs. The constraint remains institutional trust. Ethiopia’s university-industry linkage literature identifies persistent mutual scepticism as the primary impediment — industry regards universities as producing theorists; universities regard industry as offering exploitation rather than partnership.
Kenya: The Structural Inflection Point
Kenya has made the boldest legislative bet on education-as-economic-infrastructure of any African country in the 2020s — and 2026 is the year the first cohort produced by that bet enters Senior Secondary School.
The Competency-Based Curriculum (CBC), which replaced Kenya’s 8-4-4 system, mandated coding and digital literacy across all basic education. The pioneer CBC cohort sat the Kenya Junior Secondary Education Assessment in 2025, and the results carried an unmistakable signal: 59.09 per cent of students demonstrated readiness for the STEM pathway, the largest single track available, according to the Kenya National Examinations Council (KNEC) results released in January 2026, with approximately 60 per cent expected to stream into STEM at Senior Secondary from 2026. This is not merely a curriculum milestone — it is a structural volume increase in the STEM pipeline that, if absorption capacity is built, will expand Kenya’s graduate output significantly within a decade.
Infrastructure investment is tracking the policy intent. The government has committed to constructing 2,600 new laboratories from January 2025, the African Development Fund has approved US$73.31 million for Kenya’s Higher Education Science and Technology Project Phase II, and Cabinet approval of Phase III of a Kenya-China TVET modernisation programme will equip 70 institutions across eight priority technical disciplines while retraining 1,190 instructors. All TVET institutions transitioned to Competency-Based Education and Training frameworks as of January 2026.
The Kenya ICT Authority’s University of Nairobi Centre of Excellence, targeting annual placement of 5,000 graduates into BPO and ITES employment, provides a concrete employment anchor at the other end of the pipeline. The systemic question policy documents cannot yet answer is whether domestic technology employers are scaling fast enough to absorb the cohort these reforms are designed to produce.
South Africa: Funding Intent, Distribution Failure
South Africa’s student financial aid system — NSFAS — was designed as the continent’s most ambitious higher education access programme, and its 70/30 funding skew toward STEM programmes signals unambiguous policy intent. In 2026, 1.24 million students were approved for NSFAS support, with R6.3 billion disbursed under the Missing Middle Loan Programme.
But the NSFAS crisis of 2025–2026 is not primarily a funding volume crisis. It is a distribution timing crisis. Delayed verification processes have left students unable to register at the start of the academic year — meaning that students from low-income families, who cannot self-finance the gap between acceptance and disbursement, are effectively excluded from the pipeline before the semester starts. For STEM specifically, the timing failure hits the cohort that the 70/30 skew was designed to support.
More than 100,000 student appeals were logged in early 2026 following the disbursement delays. Parliament formally flagged concerns about 2026 academic year readiness. The longer-term risk is that South Africa’s STEM pipeline narrows precisely when the country’s comparative advantage in African research capacity most needs defending.
Sources: NITDA/3MTT programme reports; Nigeria Jubilee Fellows Programme 2024 data; Ethiopian Ministry of Education designated university mandate framework; Jimma University industry placement data; Discover Education (2025); Microsoft-Gebeya partnership announcement; Kenya National Examinations Council (KNEC), KJSEA results January 2026; ADF Kenya Higher Education Science and Technology Project; Kenya ICT Authority; South Africa NSFAS Annual Report 2025–2026; DHET data.
What Would It Take
The building blocks for closing the research-to-revenue gap are not hypothetical. They exist, in partial form, in the institutions, data, and policy frameworks examined in this report. The question is whether Africa’s governments, funders, and universities will move from building blocks to buildings — and whether they will do it at the pace the continent’s fastest-growing industries require.
Four interventions are preconditions for everything else.
Capitalise the African Science, Technology and Innovation Fund. STISA-2024 promised this mechanism in 2014 and left it uncapitalised for a decade. STISA 2034 has renewed the commitment. Whether the outcome is different depends entirely on whether AU member states treat the fund as a real financial instrument rather than a line item in a strategy document. Without a capitalised continental fund, R&D investment will remain dependent on national budgets that chronically underfund research and on donor aid that is structurally retreating.
Build M&E infrastructure that can actually measure progress. Thirty-five of 54 African countries cannot measure their own R&D spending. A commitment to 1% of GDP is meaningless without the statistical capacity to track whether it is being met. The ASTII programme’s work training over 3,500 civil servants in R&D measurement is a model for what this looks like at scale. It needs to reach every country with a research university.
Activate technology transfer offices as functional institutions, not compliance checkboxes. The NIPMO survey finding — 92% of South African universities have a TTO, 60% say they cannot commercialise their own IP — is the clearest available data on the gap between structure and function. A TTO without commercialisation staff, deal-making capacity, and access to pre-seed capital is a filing cabinet. Activating the continent’s TTOs requires targeted investment in human capital (experienced commercialisation professionals are rare and expensive) and in the domestic venture capital ecosystem that should absorb their output.
Build domestic graduate labour markets that give skilled professionals a reason to stay. The brain drain is not primarily a policy failure. It is a market signal: OECD salaries, research infrastructure, and career advancement opportunities are not available at home. The interventions that have made the most measurable difference — Ethiopia’s designated university mandates, Kenya’s CBC pipeline, Nigeria’s NJFP employer linkages — work precisely because they create a domestic market pull. No amount of diaspora repatriation programming will substitute for an economy that can absorb and reward its own graduates.
The gap documented in this report is structural. It did not accumulate in a decade and will not close in one. But Africa’s fastest-growing industries — fintech, health technology, clean energy, digital services, agritech — are generating the demand signal that could, if it is met with the right institutional investment, finally make closing that gap worth the effort. The research is being produced. The talent is being trained. What is missing is the building.
— BETAR Research & Education Desks | March 2026 | BETA-606